We've all been in Aria Operations exploring metrics and properties and noticed some of them are yellow, like this VM.

What does this mean? It means one of three things:
There in an Active Alert against that metric/property
There is an Active Symptom against that metric/property
There is an Active Events against that metric/property.
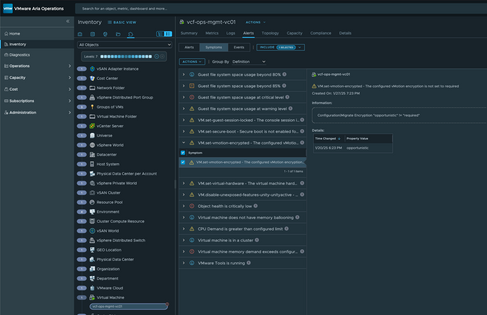
Let's have a look at this particular VM and one of the metrics that is highlighted in yellow.

Going to the Alerts tab, you'll notice an Active Alert using this metric.


Next, let's look at a couple Properties on this same VM that are highlited in yellow.

As you can see here, both of these have Active Symptoms.


Finally, looking at a couple more metrics.

While there aren't any Active Alerts or Symptoms against these metrics, there are Events.

These are internally generated Events, things like Dynamic Threshold (DT) violations.
Alerts, Symptoms, Events, Metrics, and Properties are valuable constructs in Opeations, use them!